Developed a Python-based application that automates the creation of technical datasheets for electric motors. The program reads input data stored in a CSV file such as torque, current, and angular velocity, and processes it using NumPy for numerical analysis. It contains a multi-step filter, incorporating statistics concepts such as polynomial fitting and quantile regression. It then generates high-quality plots with Matplotlib, including performance curves and characteristic diagrams. Finally, the PyLaTeX library is used to compile all processed data and visualizations into a professionally formatted PDF datasheet in LaTeX.
The tool was designed to streamline documentation in an engineering context, reducing manual formatting work and improving consistency. It supports flexible data inputs and can be extended to accommodate various motor types. This project strengthened my skills in scientific programming, data visualization, and LaTeX automation, while also demonstrating how Python can be used to bridge technical analysis with report generation.
The GUI of the program was written with Tkinter.
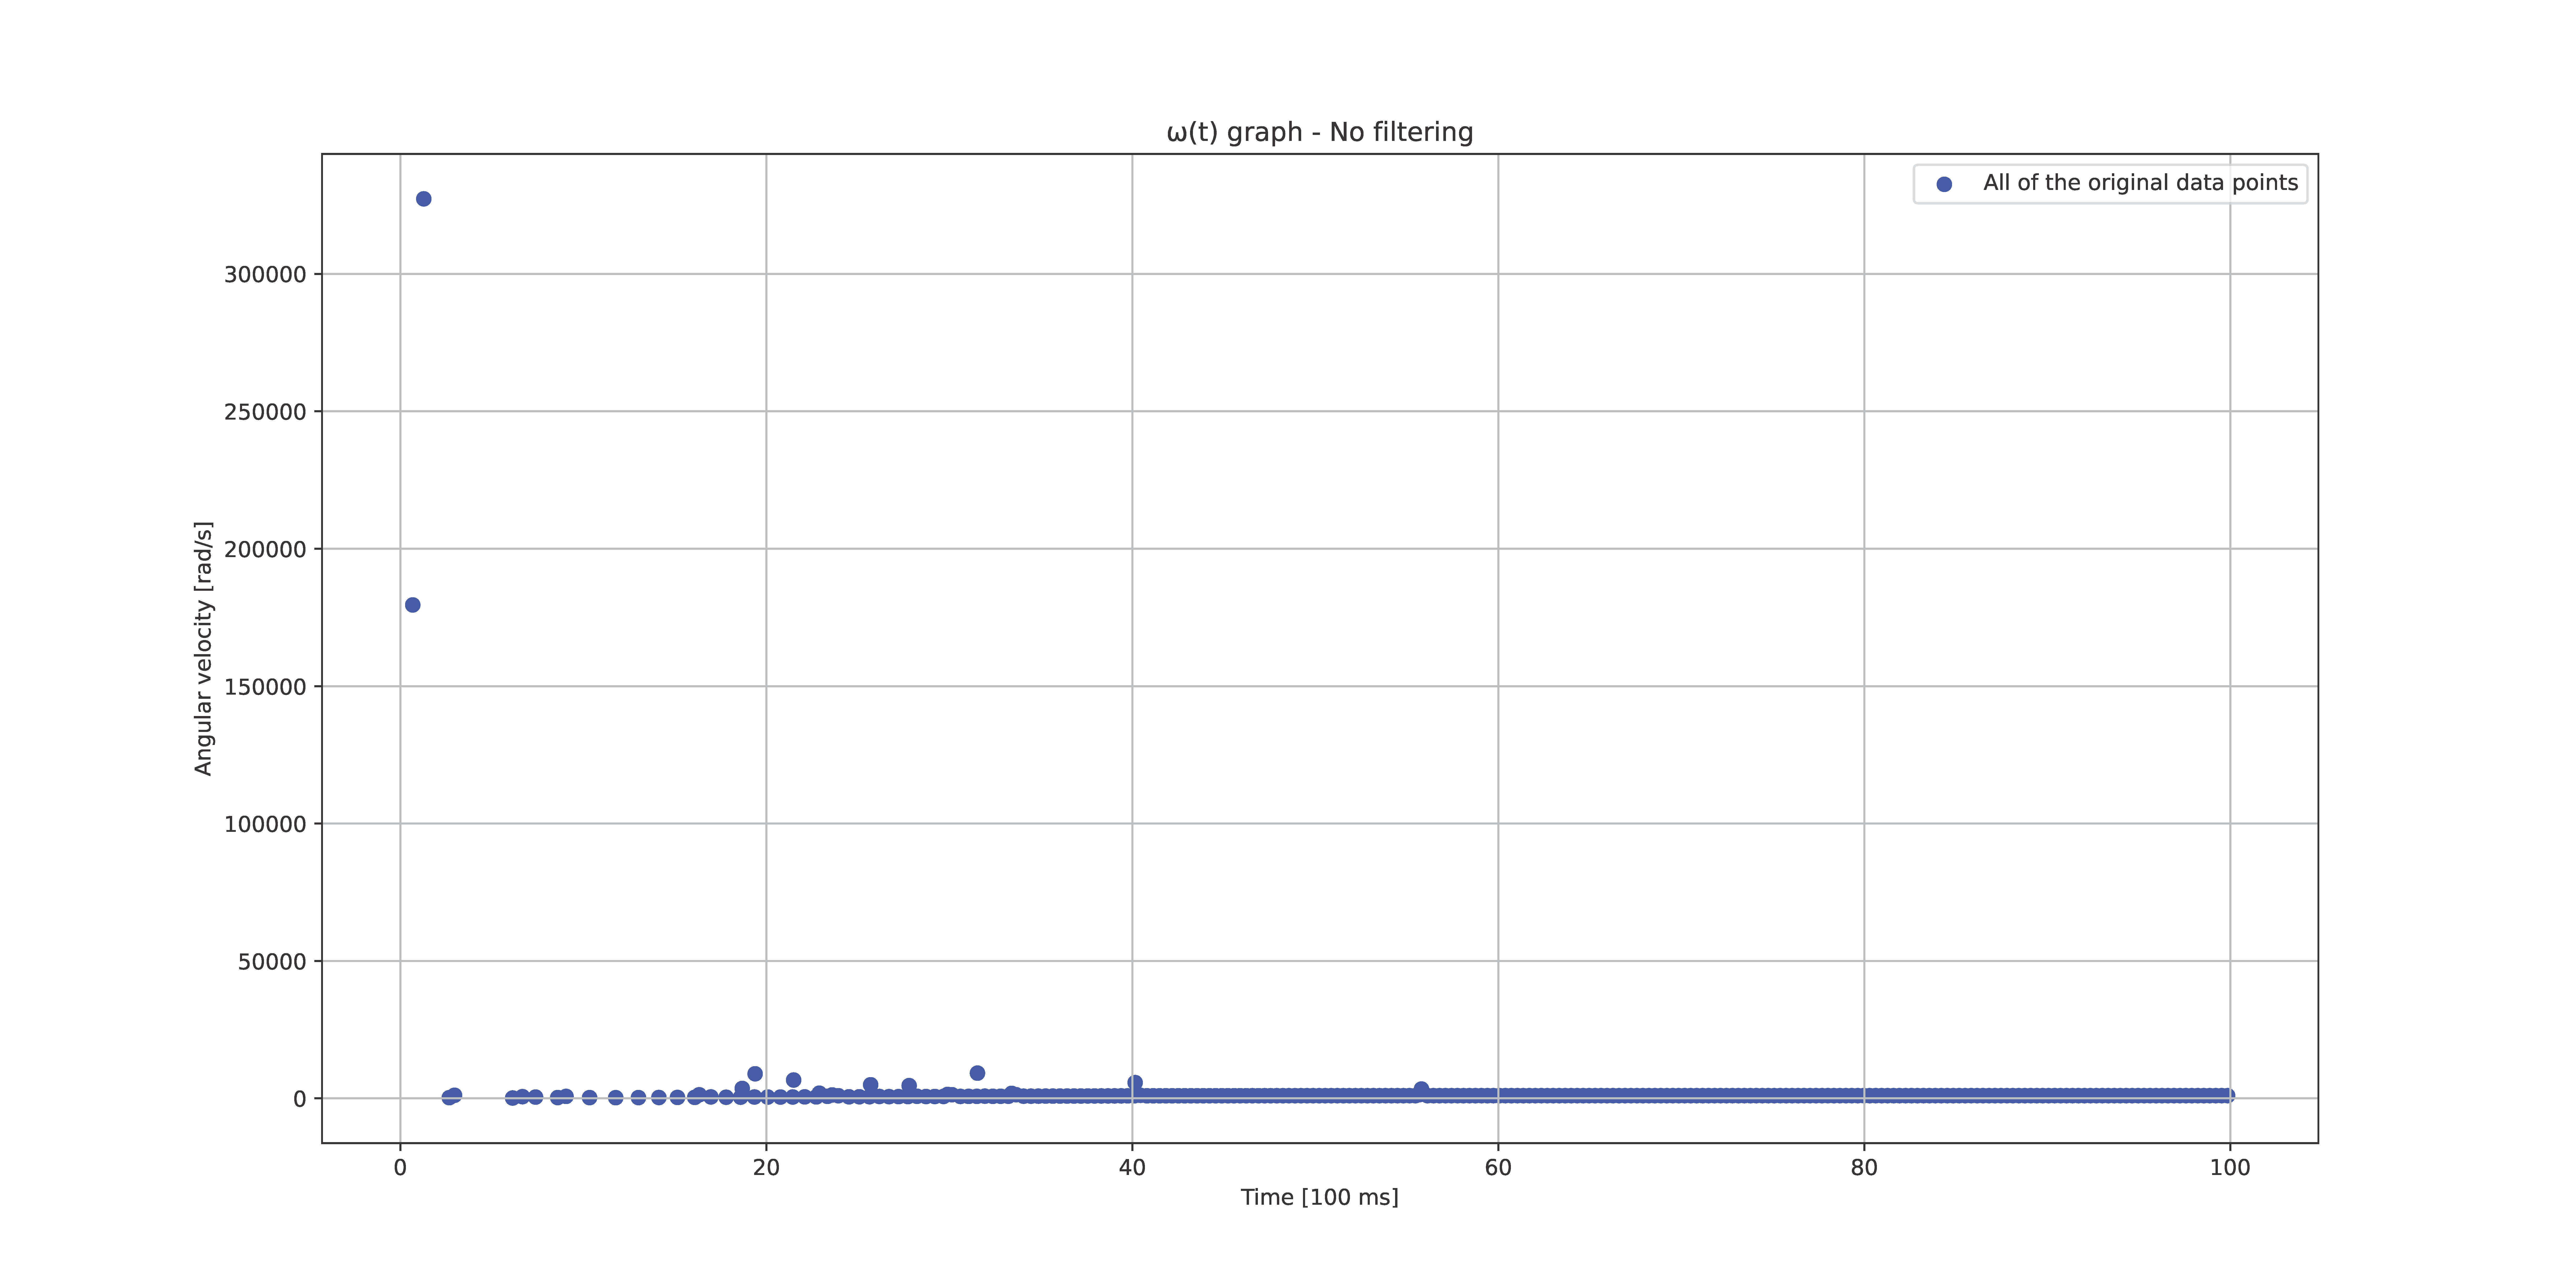
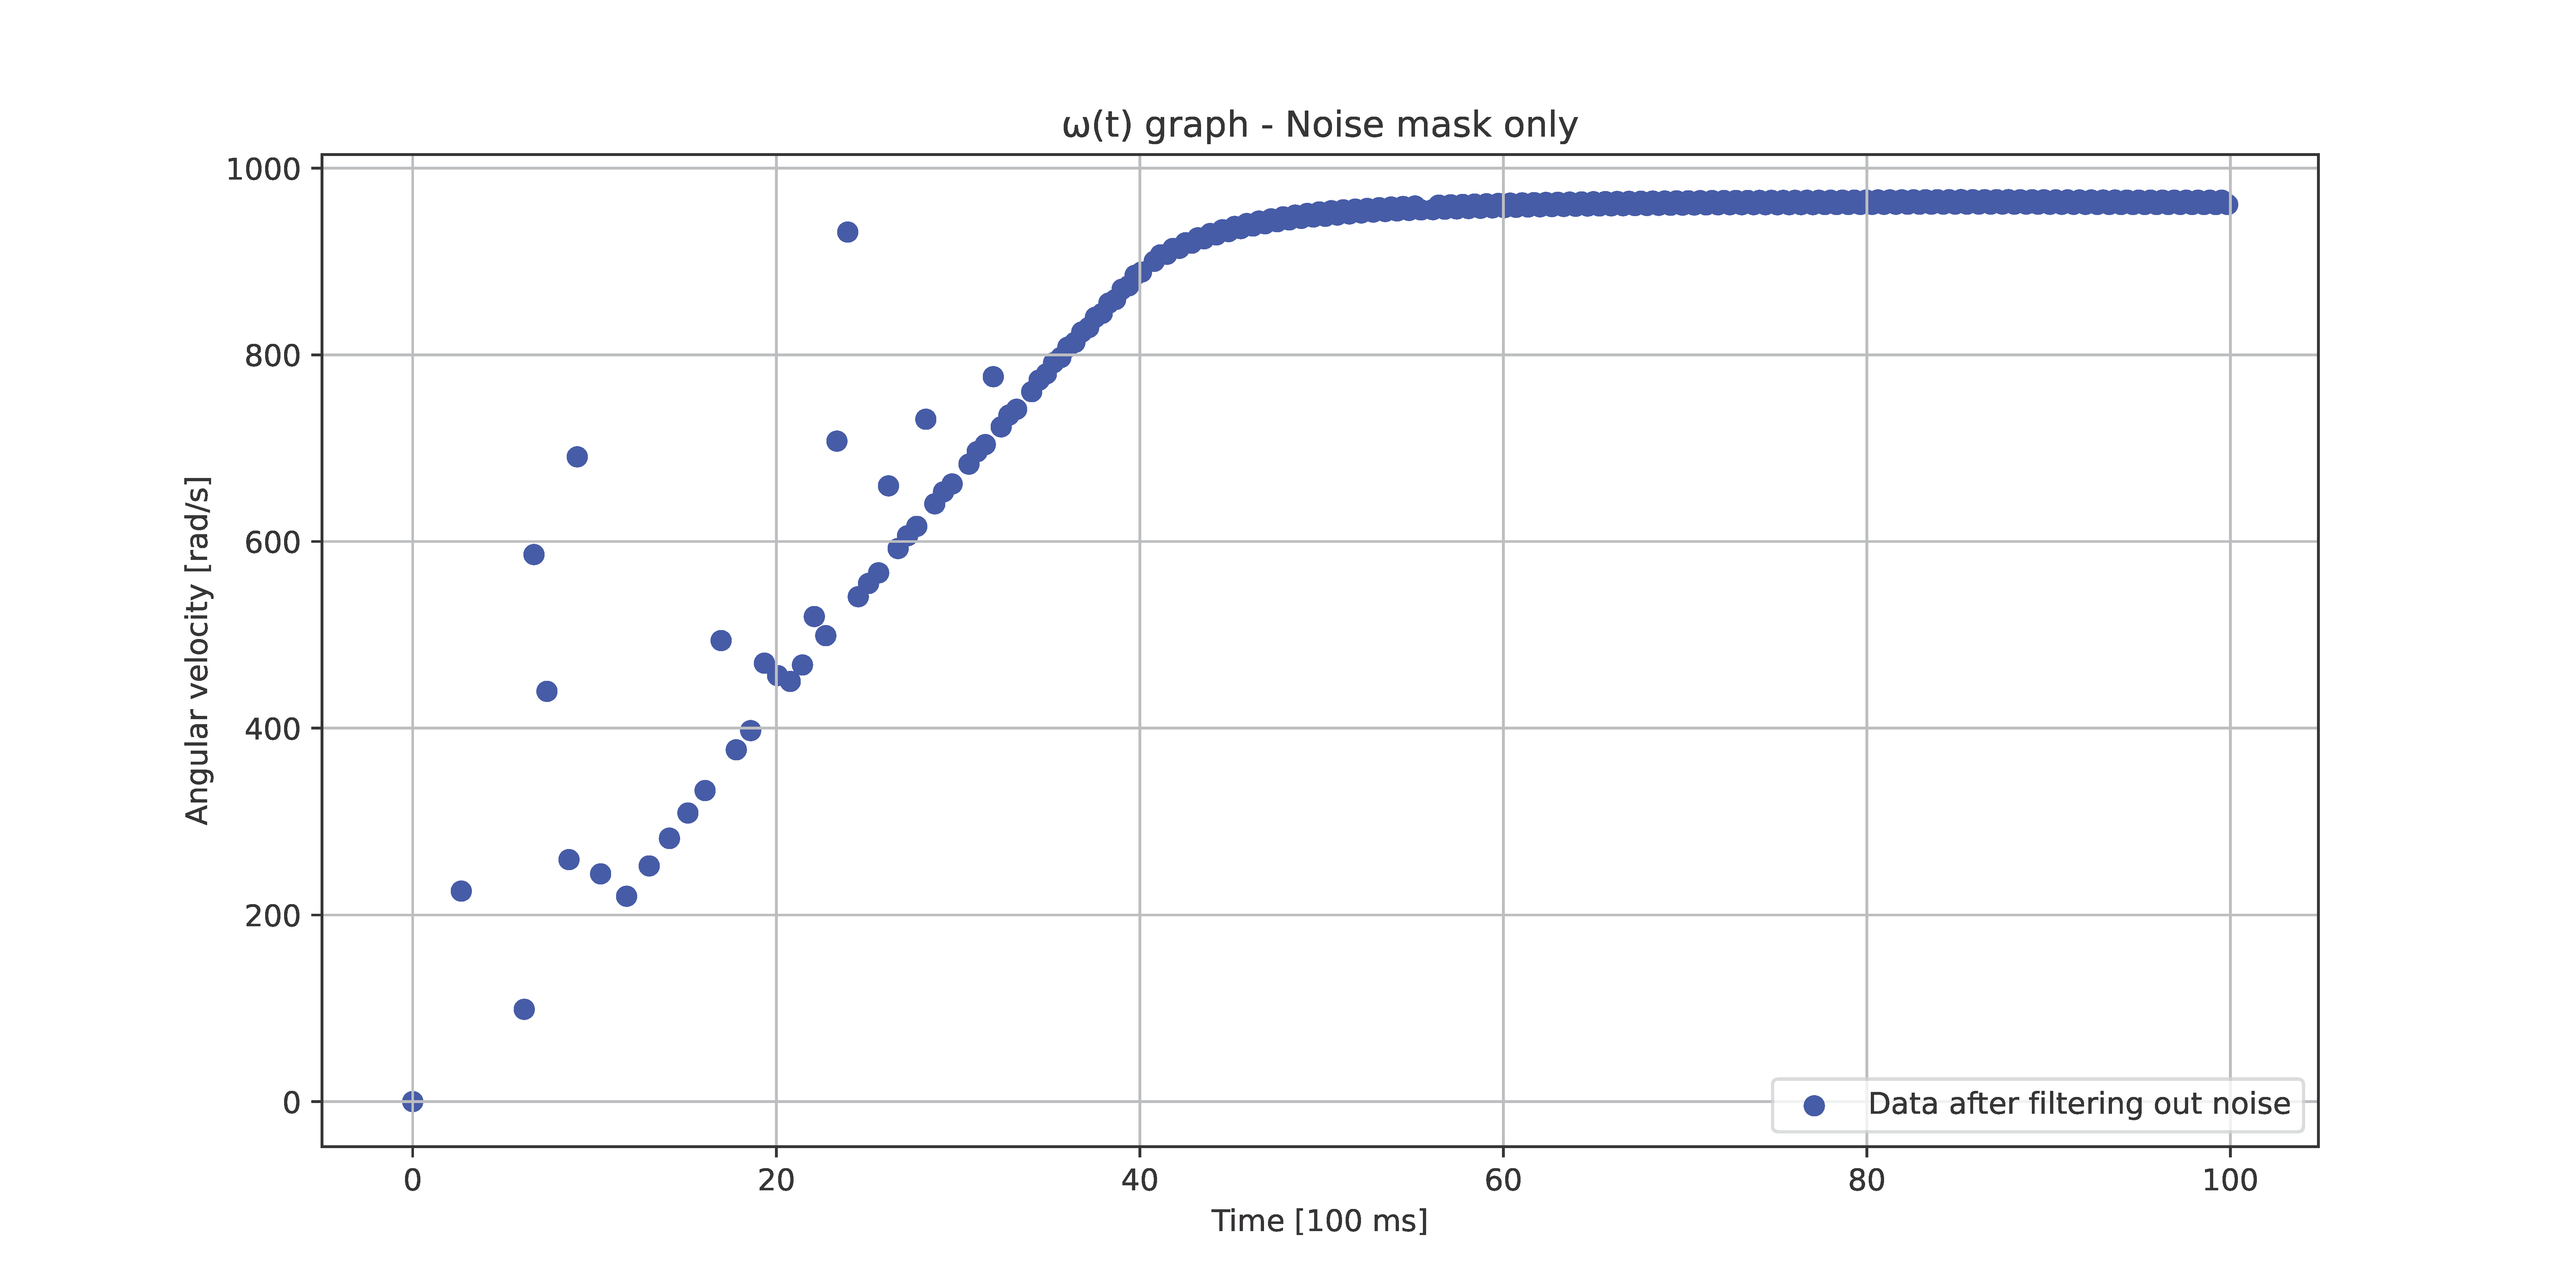
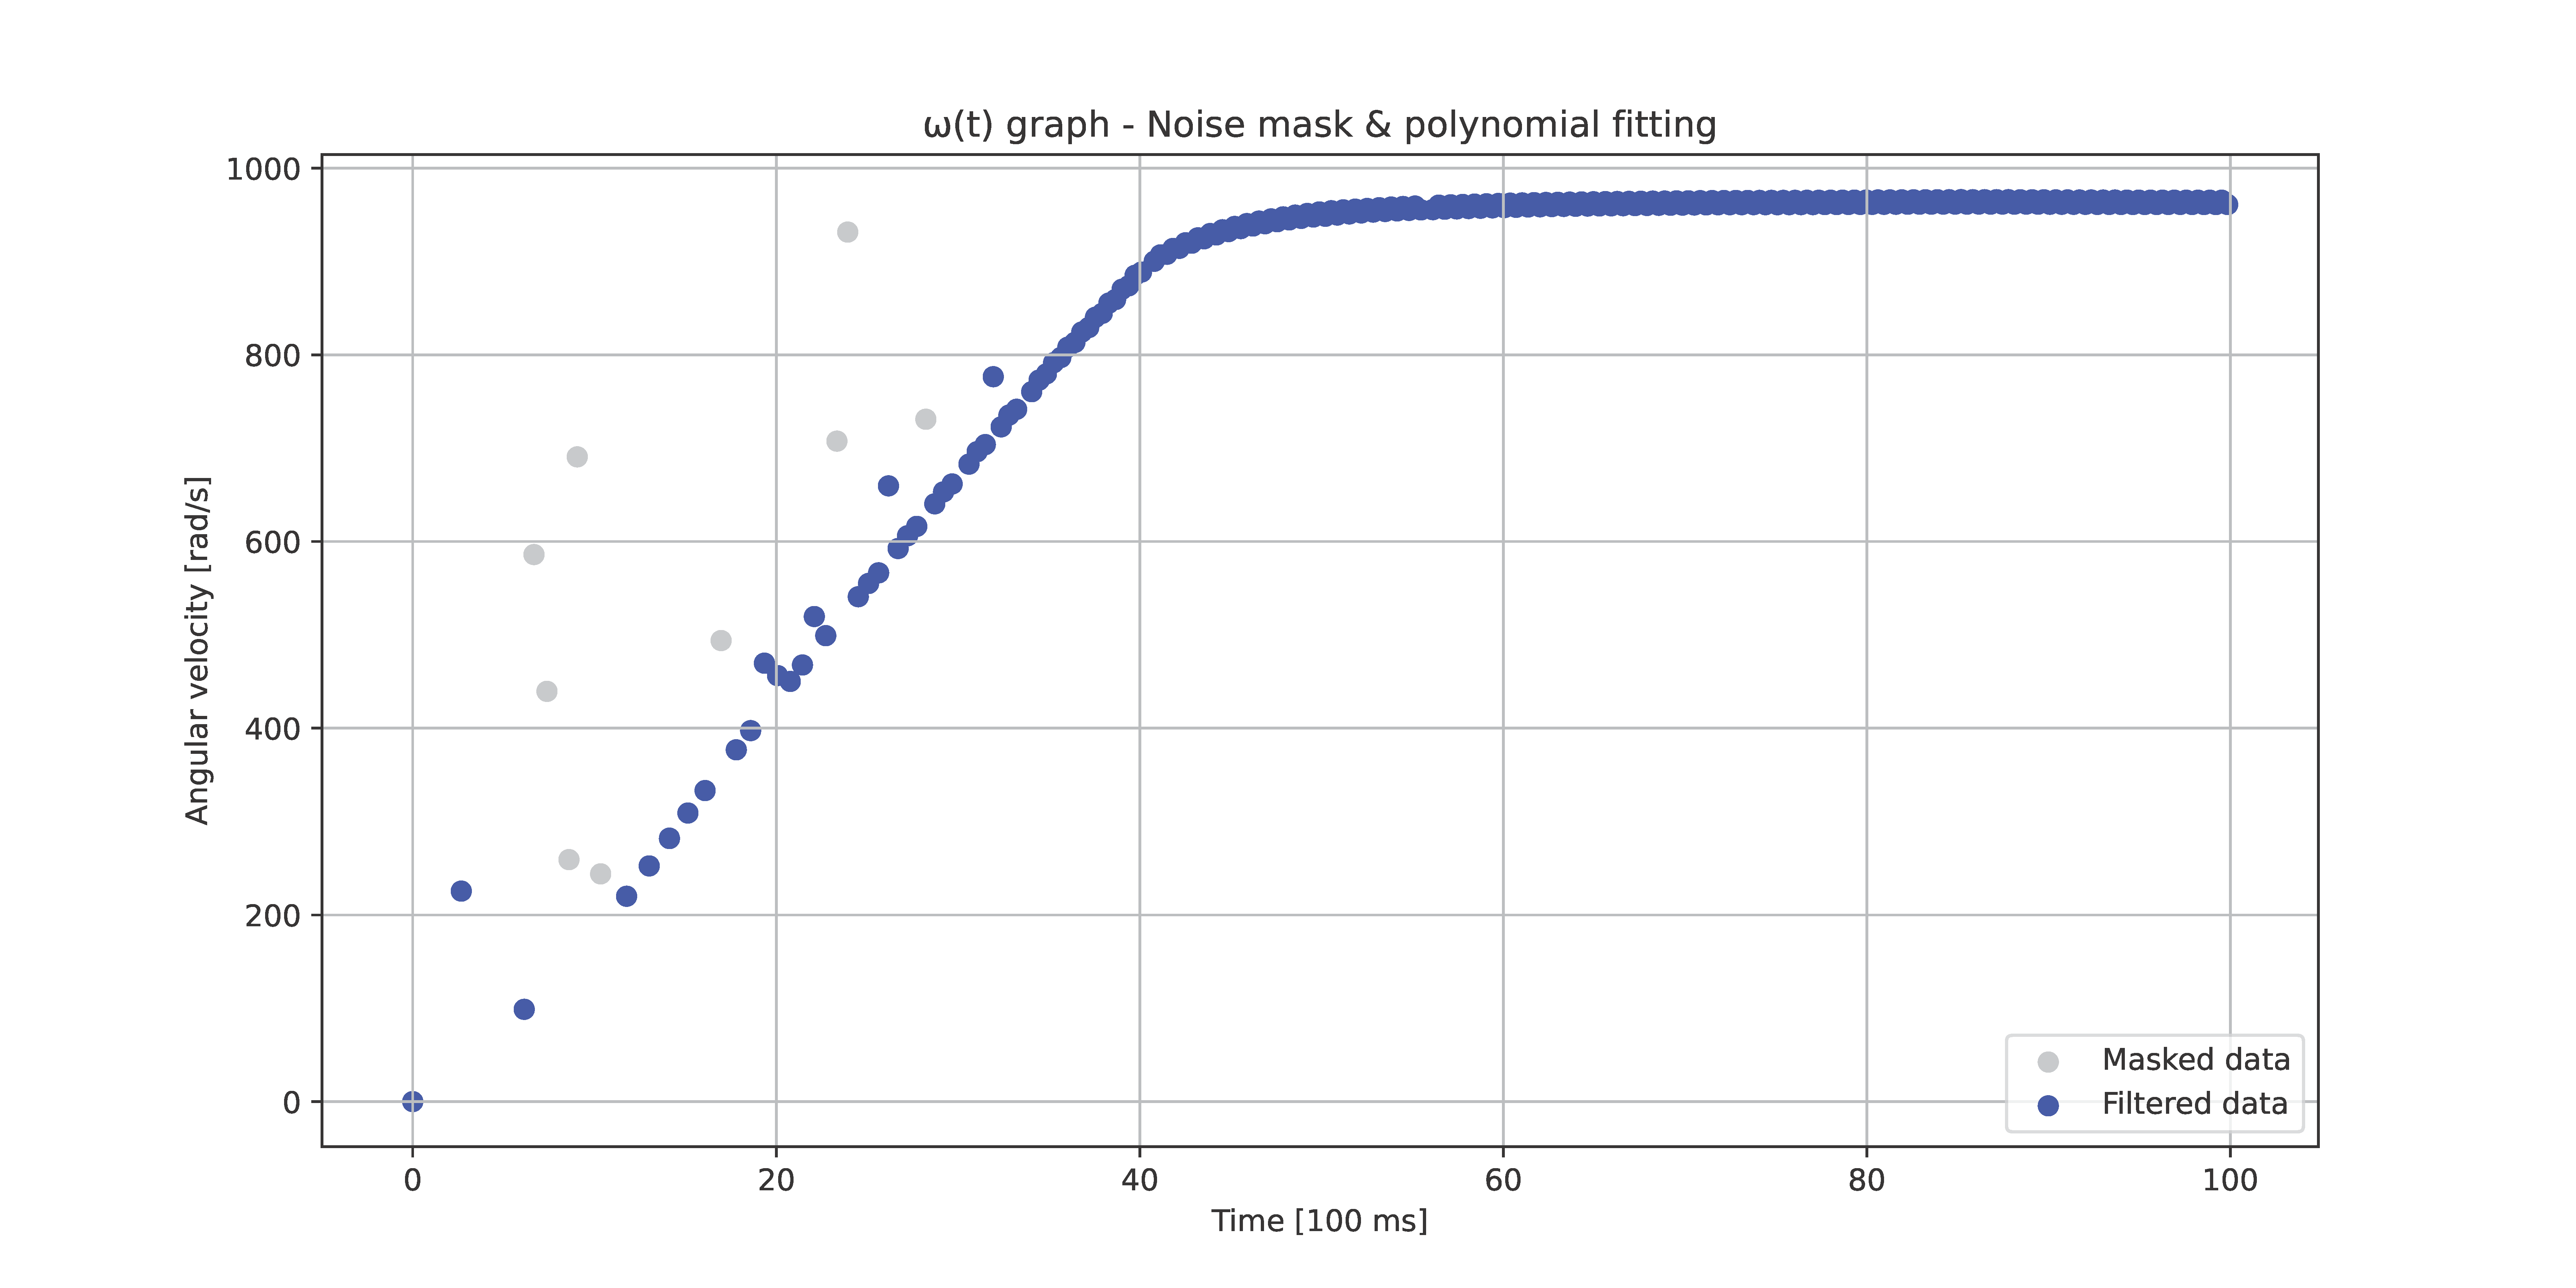
The images below show a set by step filtering of a dataset describing motor characteristic. The end result is expected to look like a logistic function.

1. Plot of the unfiltered data

2. Plot after noise removal

3. Plot after noise removal and polynomial fitting